
Predictive Analytics and Cost Containment

Predictive analytics is essential for managing medical expenses and enhancing health outcomes for health plan members. The Health Risk Monitor (HCRM) app identifies “MOVERS,” who are members expected to experience a substantial increase in costs and clinical risks. Clinical users can quickly and accurately pinpoint and categorize members based on their future healthcare expenses and clinical risks, resulting in improved health and reduced costs. This identification can lead to cost-saving opportunities by managing these members and potentially preventing catastrophic claims. The Stratification Report categorizes members based on their projected costs and clinical risks, offering a clear guide for implementing cost-containment strategies.
Cost Saving Opportunities
Another potential cost-saving opportunity is working with the catastrophic population. Around 5% of the population drives most of the health plan spending. Health Risk Monitor identifies future catastrophic members so that our clients can be sure they are being managed before claims are incurred.
Trend reporting provides outcomes of any cost containment effort, specifically focusing on catastrophic members. The following analysis from one of our clients demonstrates how this tool can effectively showcase outcomes.
Predictive Analytics and Cost Containment Analysis
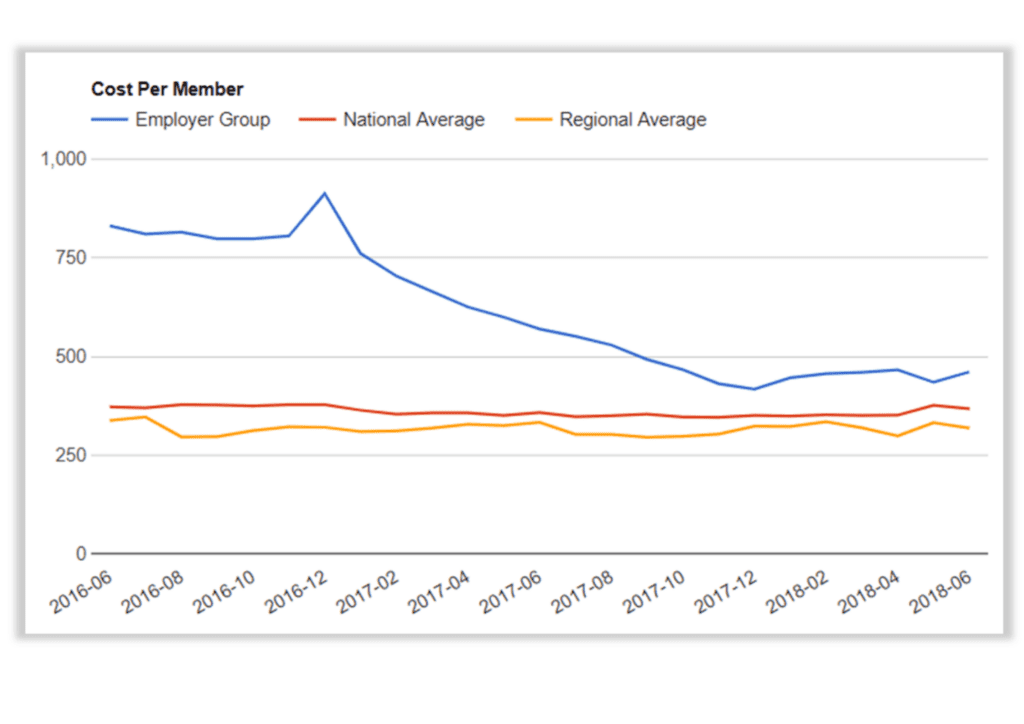
This report compares an employer group to the national and regional benchmarks. This comparison identifies areas where the employer group is performing well and areas where there is room for improvement.
The employer group significantly reduced costs over two years, lowering the cost per member from $825 to $450. The group achieved this reduction by effectively working with the catastrophic population, underscoring the potential of predictive analytics in cost containment.
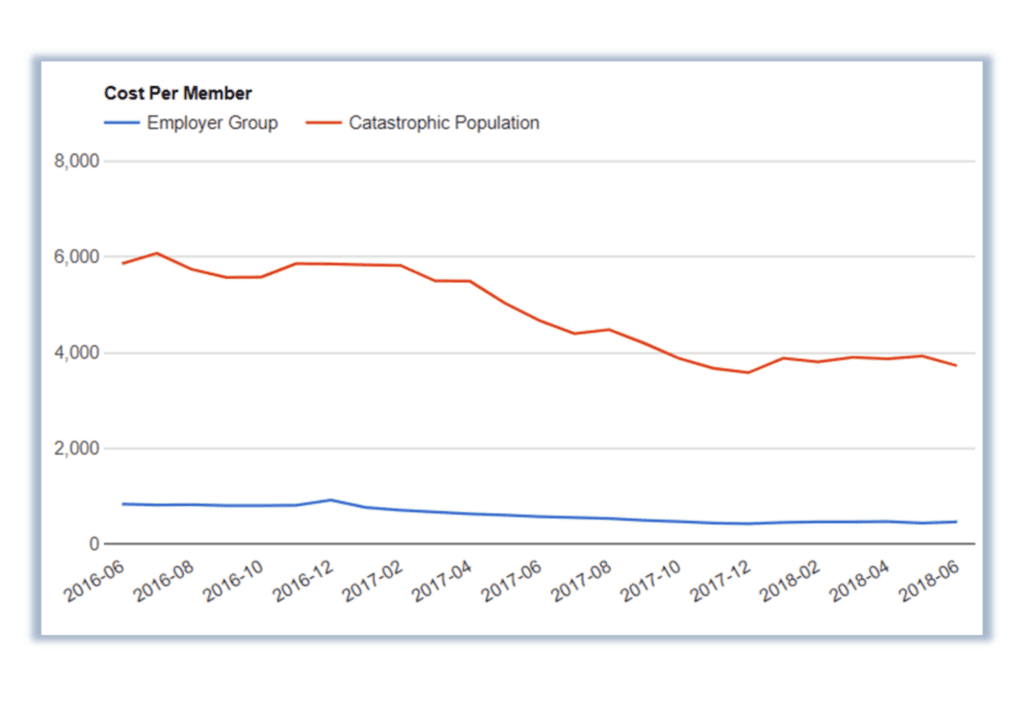
This graph illustrates the catastrophic population in the same employer group. (5% of the population) and how the catastrophic member’s trend compared to the employer group baseline over two years. The catastrophic members saw a reduction from $6,000 per member per month to just under $4,000, emphasizing the importance and effectiveness of working with the catastrophic population or the top 5% driving most of the spend. NOTE: the blue “Employer Group” line below is the same as the above, but the scale has changed.